
Table of Contents:
Chapter 1: Welcome to the GA4 Universe - A Quick Introduction
Chapter 2: Configuring a GA4 Property - What Other Guides Don’t Tell You
2.1: Extend your Data Retention Policy
2.2: Define your Internal Traffic
2.4: Utilise Custom Event Measurement with Custom Definitions for Bespoke Conversion Tracking
2.5: Leveraging The Pros of Google Signals, and Bypassing the Cons
Chapter 3: Explorations - Getting the Most Out of Your GA4 Property
3.14159: Google BigQuery - Enhance your Data Analysis
Chapter 4: Google Looker Studio - The Art of Data Storytelling
Chapter 5: The Final Analysis - What We've Learned About Google Analytics 4
1. Welcome to the GA4 Universe - A Quick Introduction
Those who work within the digital marketing world will have likely crossed paths with Google Analytics at some point in their professional journey. Recent statistics demonstrate that Google has the largest market share in web analytics[1] and suggest that approximately 55% of all websites use Google Analytics[2].
For those who don’t know, Google Analytics is a platform that collects data from your websites and apps to create reports that provide insights into your business[3]. It has been around for a very long time; almost 18 years in fact following its launch in November 2005. After 7 years of continuous development and optimisation the third generation of Google Analytics was rolled out in 2012, the infamous Universal Analytics!
For a further 8 years the web analytics community lived in harmony; possessing a pragmatic and intuitive web analytics tool, with many users actively contributing to online guides and forums to support others in their data endeavours. It was in October 2020 however that everything changed…
Figure 1: The announcement of Google Analytics 4[4]
Many of us living in the Google Analytics 4 universe consider this Google blog post to have been equivalent to the Big Bang. The announcement details numerous reasons why Google chose to develop GA4 – however, the leading factor was changes to global data privacy laws.
Check out this article by Demand Generation Director Nick Williams on the importance of data compliance and the GDPR: https://www.7dots.com/our-insights/website-cookies-and-tracking/
To comply with progressing regulations such as the GDPR, UA’s session-based data collection model (and session-scoped mentality adopted across the web analytics community) had to be dropped, as GA4’s new event-based data model was introduced to deliver user-centric measurement.
Google prided themselves in this new platform, delivering statements such as:
- “Smarter insights to improve your marketing decisions and get better ROI”
- “A more complete understanding of how customers interact with your business”
- “Built for the long term”
- “The future of Google Analytics”
Some chose to set aside their GA4 migration until action was necessary, whilst others enthusiastically jumped into configuring new properties to run alongside their existing Universal Analytics set-up.
The playing field was soon levelled however in March 2022, when Google announced:
“ALL STANDARD UNIVERSAL ANALYTICS PROPERTIES WILL STOP PROCESSING NEW HITS ON JULY 1, 2023”[5]
Despite Google’s best endorsements & efforts to popularise the new platform, the web analytics community who had grown fond of Universal Analytics did not respond too well…
Headlines such as “10 things we hate about Google Analytics 4”[6] soon began climbing up the SERPs, with Twitter (or X if you ignore the domain) polls revealing that 50% of SEOs hate Google Analytics 4[7].
This has been a common theme in guides and blogs for the last few months, however, this is not what this article is about!
We are here to resolve the challenges facing the digital analytics community today and discuss the methodologies 7DOTS have developed to take advantage of Google Analytics 4. This guide will help you understand the power of GA4, and why after applying the following strategies, it’s really not as bad as you think!
2. Configuring a GA4 Property - What Other Guides Don’t Tell You
By now I’m sure you’ve been made familiar with the basic configuration steps required to configure a GA4 property; creating a data stream and adding the Google tag to your website or app. This Google documentation breaks down this process into clear steps, as do many other online guides and video tutorials. This can be actioned directly on the site, or for improved scalability and maintenance, via a tag management system such as Google Tag Manager (commonly referred to as GTM).
The following points on the other hand are commonly disregarded, however are essential for creating an optimised GA4 property and enhancing your data analysis capabilities. Here is a brief look into the procedures 7DOTS have endorsed.
2.1. Extend your Data Retention Policy
By default, a new GA4 property will have its data retention period set to 2 months. This does not mean that data will only be available for 2 months your standard aggregated reports will retain data indefinitely.
However, it does make historical analysis difficult as you are limited to only a 2-month look-back period within explorations and funnel reports, which are needed to deep dive into your data. Historical analysis such as year-on-year comparisons is fundamental for identifying and understanding trends in user behaviour over time, and as such being able to only analyse the previous 2 months of data is not sufficient.
To increase your data retention period, head into your property settings, and under the property column select “Data Settings”, and then “Data Retention”. Here, you can extend your event data retention from 2 months to 14.
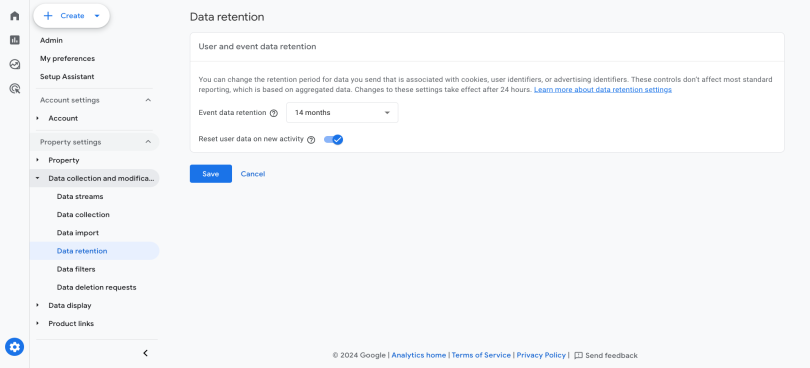
Figure 2: Where to Find Google Analytics 4 Data Retention Settings
To extend the data retention period even further (without succumbing to the heavy costs of Google Analytics 360) we can move into the world of Google BigQuery, however, we will discuss that later…
2.2. Define your Internal Traffic
If, like us, you or others regularly visit your site for testing or to inspire design updates, it is necessary that you identify yourself as a user within a GA4 property so that you can filter out your data from reports. This is crucial to prevent skewing key metrics such as average engagement time or conversion rate. You can identify which data is yours through your IP address.
Traffic originating from a specific range of IP addresses can be identified as internal traffic. This classification is reflected in the event data through a parameter called “traffic_type”, which is set to “internal” by default. This allows us to easily exclude internal traffic from any analytics reports by generating a simple filter.
You can find out your IP address by googling “what is my ip”. Once you know which IP addresses you wish to set as internal (or another value such as “london_office”), we can define these within GA4.
Within your property settings under the property column, find your data stream and select it to view the stream details. Next, select “Configure Tag Settings” -> “Show more” -> “Define internal traffic” -> “Create”. Here, you can define a new internal traffic rule.

Figure 3: An Example Internal Traffic Rule Definition
2.3. Create Product Links
When working within the Google ecosystem, you will likely be utilising additional platforms such as Google Ads to run campaigns, or Google Search Console to monitor your organic landscape performance.
GA4 allows you to consolidate information from across these platforms within your property, to create an accessible data hub where all your analytics questions can be answered.
Within your property settings, the following product links are currently available for configuration, and upon selection provide clear instructions on set-up.
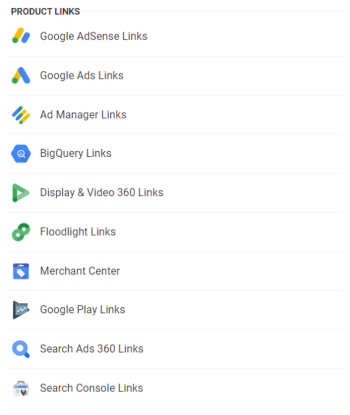
Figure 4: Currently Available Product Links in Google Analytics 4
2.4. Utilise Custom Event Measurement with Custom Definitions for Bespoke Conversion Tracking
Previously, with Universal Analytics, most marketers would create a selection of the same event tags; page views, scrolls, outbound clicks, site searches, form interactions, video engagements and file downloads. Now, all of these tags are offered with GA4’s out-of-the-box solution, enhanced event measurement!
GA4’s new enhanced measurement feature is a fantastic addition to the platform; however, it is worth testing to ensure each event measurement is compatible with your website, especially the form interaction measurement!
Further to this, users should not feel limited to only collecting these events. A common custom event we measure is CTA views and clicks on a site, to educate the engagement changes following design A/B tests.
Note: We recommend using Google Tag Manager for the configuration of custom event tags as it is built with Google products in mind, and it’s preview mode provides an insightful level of transparency when debugging.
When creating custom events, the first thing to remember is to follow Google’s event naming rules:
Always follow Google’s event naming rules
Google has provided the following rules to follow, to ensure your custom events do not result in conflicts or complications:
- Event names are case sensitive. For example, my_event and My_Event are distinct events.
- Event names can include English and non-English words and letters.
- Do not use reserved prefixes and event names.
- Event names must start with a letter. Use only letters, numbers, and underscores. Don't use spaces.
Utilise event parameters
The second thing to remember is to utilise event parameters. Event parameters let you capture additional information about an event and are written as key-value pairs, where the value on the left is the event parameter name and the value of the right is the event parameter value. They also promote tidy and scalable tag maintenance.
For example, using the CTA click and view events described earlier as an example, we can create a singular “cta” event with a ”state” or “action” event parameter to distinguish if the recorded CTA event was a click event or a view event. We can capture as much data as we like about this event using event parameters such as the CTA text or class for more detailed insights. But remember, to visualise this data in GA4 and see event parameter values we must also create custom dimensions!
Create custom dimensions
Once again by navigating to your property settings, you can select “Custom definitions”, and then “Create custom dimension” to select your new event parameters and give them friendly names and descriptions. These will then be visible in your reports to provide extra opportunity for analysis!
You can now create new refined events from these custom definitions. For example, a “buy_now_click” event may be defined as an event where event_name equals “cta”, cta_state equals “click” and cta_text contains “Buy Now”. This can be actioned within the admin settings section, under the “Events” data display settings by creating additional custom events which meet certain event parameters.
Mark your most significant events as conversions within your GA4 property
Finally, after creating all your events of interest, the actions that are most important to your business can be marked as conversions within your GA4 property settings allowing you to fully understand the impact of your marketing efforts and the commercial performance of specific pages on your site and attribution channels.
2.5. Leveraging The Pros of Google Signals, and Bypassing the Cons
Originally, this section was intended to be called “The Pros and Cons of Google Signals”. However, following a GA4 update on October 2nd 2023 to exclude Google signals data from reports and explorations, we can now focus on the pros and explore how the cons have been terminated.
When creating a new GA4 property, Setup Assistant strongly encourages you to enable Google Signals, but what are they? Well, from Google documentation, Google signals are described as “session data from sites and apps that Google associates with users who have signed into their Google accounts, and who have turned on Ads Personalisation.” This enables:
1. Cross-Platform Reporting
This feature allows you to connect data about devices and activities from different sessions, to understand user-behaviour at each stage of their journey across devices! This not only improves the accuracy of user counts in reporting, but also lets you recognise key conversion paths on your website to drive actionable insights.
2. Remarketing with Google Analytics & Advertising Reporting Features
Google signals let you create remarketing audiences for linked advertising platforms such as Google Ads, allowing you to optimise spend and offer highly relevant ads for cross-device remarketing campaigns.
3. Demographics and Interests
The user attributes demographic details report adopts Google signals data to visualise users by their age, gender & interests, allowing you to get a better understanding of who is visiting your site and subsequently focus your efforts on the most promising audience of users.
Whilst all of these features are incredibly useful, they did previously bring rise to a significant limitation of GA4; data thresholding.
Data thresholds are a security feature introduced by Google to prevent anyone from inferring the identity of individual users based on demographics, interests or other signals present in the data. These thresholds meant that in some instances you could only view a subset of your data, with some rows of data being selectively hidden for user privacy. This led to uncertainty in the reliability of GA4 data, and this common lack of confidence in results caused a great deal of frustration.
But as mentioned earlier, Google recognised this resentment, and on October 3rd 2023 introduced an update allowing users to exclude Google signals data from their reports and explorations. This has meant that whilst specific demographics and interest data have been omitted from reports, Google signals data can still be used in audiences and conversions and shared with Google Ads, whilst at the same time substantially reducing the likelihood of data thresholding.
You can simultaneously enable Google signals and exclude Google signals in reporting identity by, within your property settings, going to “Data Settings”, then “Data Collection”, following the instructions to enable Google signals and then toggling off “Include Google signals in reporting identity”.
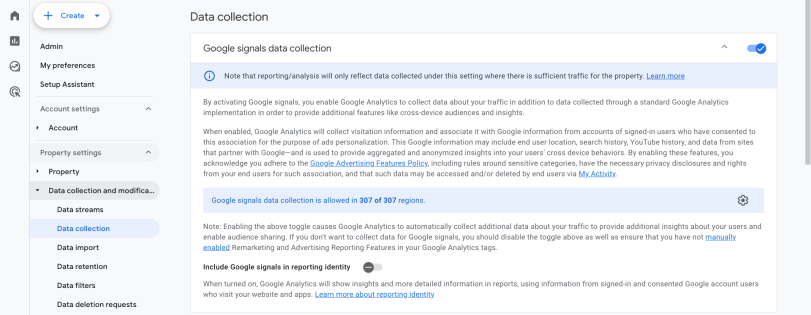
Figure 5: Where to Enable Google Signals & Exclude Google Signals in Reporting Identity
Implementing these options within your own GA4 property leaves you with the primary advantages of Google signals, without having to worry about the reliability & reproducibility of your data!
3. Explorations - Getting the Most Out of Your GA4 Property
Now that we have set-up a first-rate GA4 property, we can discuss leveraging the most detail out of the collected data within your property. We understand that the GA4 UX is less intuitive in comparison to UA’s and has been disruptive to many users’ analytics capabilities. Nevertheless, here at 7DOTS we have found the following exploration techniques useful for elevating standard reporting value.
Standard reports provide an overview of your data for the following reporting categories: acquisition, engagement, monetization, retention, user attributes and tech. The value of these can be slightly inflated by utilising comparisons and custom libraries to answer key questions at a glance on a periodic basis. However, these reports do not let you deep dive into your data. To fully take advantage of all data being collected, harnessing numerous dimensions and metrics in unison, we can turn our attention to explorations.
Explorations can be accessed by selecting “Explore” in the left navigation panel. Once here, you are presented with the option of creating a variety of different exploration types, each designed to answer different common questions. Google describes each of these explorations as follows:
- Free-form exploration
Explore your data in a familiar crosstab layout. You can also apply several different visualization styles in free form, including bar charts, pie charts, line charts, scatter plots and geo maps. - Cohort exploration
Gain insights from the behaviour and performance of groups of users related by common attributes. - Funnel exploration
Visualize the steps users take to complete tasks on your site or app, and see how you can optimize user experience and identify over- or under-performing audiences. - Segment overlap
See how different user segments relate to each other. Use this technique to identify new segments of users who meet complex criteria. - User exploration
Examine the users that make up the segments you create or import. You can also drill down into individual user activities. - Path exploration
Visualize the paths your users take as they interact with your website and app. - User lifetime
Explore user behaviour and value over their lifetime as a customer.
Each of these can be incredibly useful in their own unique ways, however for ad-hoc analysis I tend to use free-form explorations, which will be the focus on in this chapter.
If you wish to read more about other exploration types, I found the official Google “Get started with Explorations” documentation to be an insightful place to start:
https://support.google.com/analytics/answer/7579450?hl=en#zippy=%2Cin-this-article/
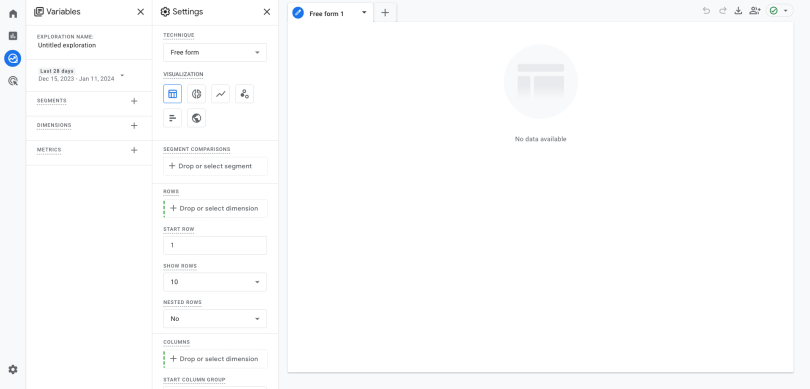
Figure 6: A Newly Created Free-Form Exploration
I was recently lucky enough to visit MeasureFest at Brighton SEO 2023, where I attended an intriguing talk on GA4 and some example practical use cases of explorations, without requiring custom event measurement. Let’s take a look at one of these examples; analysing page engagement by views compared to entrances and exits.
I personally find that when creating a new free form exploration, it is easiest to initially work from left to right. Focussing on column one, we can first give our exploration a name, select a date range of focus, and add all segments, dimensions and metrics we wish to analyse into our workspace.
*Remember: Generally speaking, dimensions are your “words” that you break down by, for example page or default channel grouping, where as metrics are your “numbers”, such as total users and views.
The dimension required for this example analysis report will be page title (and optionally traffic type if you wish to exclude internal traffic from your report as discussed in chapter 2.2), and the metrics required will be views, entrances and exits.
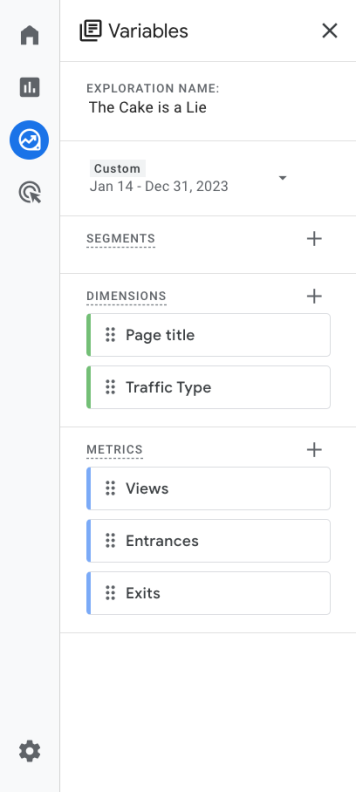
Figure 7: The First Column Configuration of our Free Form Exploration
You can now drag your “Page title” dimension into your exploration settings as a row dimension, and your views, entrances and exits metrics as your values. You can also add a filter for traffic type to exclude internal traffic if you like! The result should look something like this:
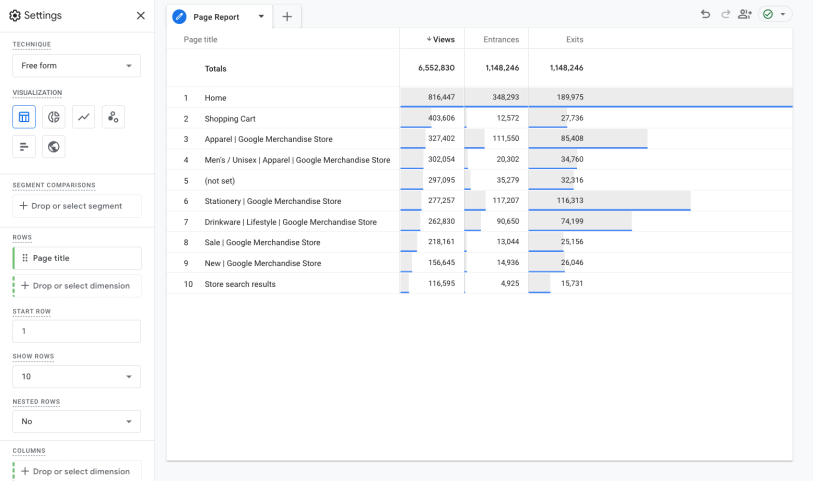
Figure 8: Page Engagement Analysis Free Form Exploration
You can have numerous tabs in an exploration and, with practice, add more advanced free forms. For example, you could look at sessions and conversion rates per landing page, with device category as a column dimension to understand attribution and performance across platforms!
These explorations can be great for quick investigations, however, do have some limitations:
- Depending on your data retention settings (discussed in Chapter 2.1), your explorations can only look back on up to 14 months of data.
- After sharing an exploration, only the exploration creator can alter the date range.
- Depending on data quantity and granularity, you may be subject to data sampling and thresholding.
- You cannot create custom fields such as calculated metrics or Regular Expression calculated dimensions on the fly, they must be pre-defined ahead of analysis.
When looking to conduct advanced data analysis within GA4, these limitations can be frustrating blockers. To take your data analysis to an expert level, the solution we at 7DOTS have found is to adopt Google BigQuery into our workflow.
3.14159. Google BigQuery - Enhance your Data Analysis
7DOTS have supported a broad range of clients with their GA4 migration challenges, from configuring basic properties to facilitating advanced, unlimited data analysis. In cases where we are required to leverage the maximum potential of GA4 data, we use Google BigQuery.
At surface level, Google BigQuery is a cloud-based data warehouse in which we can store all of our Google Analytics 4 data. This data is not only more granular, containing unsampled raw event and user-level data, but also facilitates custom data retention beyond 14 months and bypasses all API quota limit restrictions.
Google are strongly encouraging users to harness to power of Google BigQuery, and as such have even built a product link integration, allowing you to easily link a BigQuery project to your GA4 property.
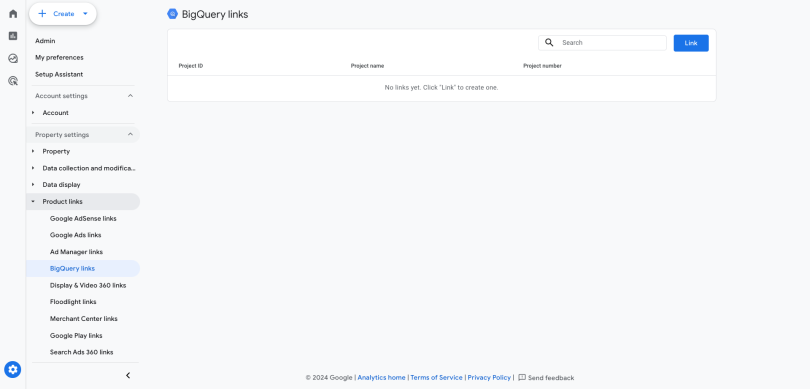
Figure 9: BigQuery Product Link Settings in GA4 Admin Property Panel.
Here at 7DOTS, we regularly use Google BigQuery to obtain actionable insights from our data that would otherwise be unobtainable from the Google Analytics platform. This has been of significant advantage to our analytics projects, however, has a rather steep learning curve.
For example, GA4 data within BigQuery is originally stored as a nested data structure. We drew inspiration from the works of Simo Ahava[8] to process and unnest data as soon as it is collected from Google Analytics 4, such that it is immediately collated in a format we can use within other platforms for tasks such as data visualisation.
We migrate the majority of our client GA4 data (as well as data from other sources) into Google BigQuery to allow for innovative analysis, uninterrupted by GA4 API quota restrictions. If you would appreciate further information on this process in the style of another post, or for support with your own analytics projects, please do let us know!
4. Google Looker Studio - The Art of Data Storytelling
Many of you budding data analysts out there may be familiar with the work of Professor Hans Rosling, co-founder of the influential Gapminder Foundation and resulting Trendalyzer software. His famous quote reminds us that whilst data collection is essential, the resulting analysis must be accessible to all:
“The world cannot be understood without numbers. But the world cannot be understood with numbers alone.”
The best way to accommodate this is through the medium of engaging and educational data visualisations, with associated meaningful insights. To provide this format of data during our projects, 7DOTS commonly employ Google Looker Studio (formerly Google Data Studio).
Google Looker Studio is a free data visualisation software built to fit seamlessly work alongside the rest of the Google ecosystem. Its friendly interface allows you to create elegant data visualisations of your GA4 data, beyond the capabilities offered within the GA4 platform.
When creating a new report in Looker Studio, you will be prompted to connect to your first data source. By selecting “Google Analytics” (or another data source if you are feeling adventurous at a later date), provided you are signed into a Google account with access to your GA4 property you will be able to see and select your property to start visualising!
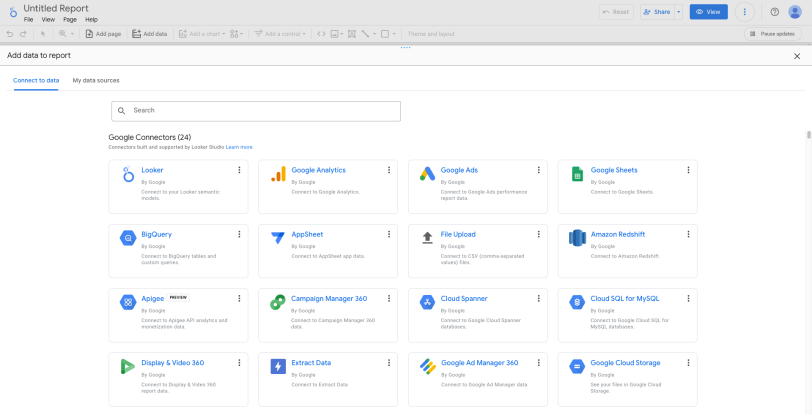
Figure 10: A Selection of Available Google Connectors in a new Looker Studio Report
Adding a stacked bar chart with “Year Month” as the primary dimension, “New / Returning User” as the breakdown dimension, and “Total Users” as a metric (and also after some basic styling) we are able to create a clear visualisation on users by type visiting our website over the last 6 months.
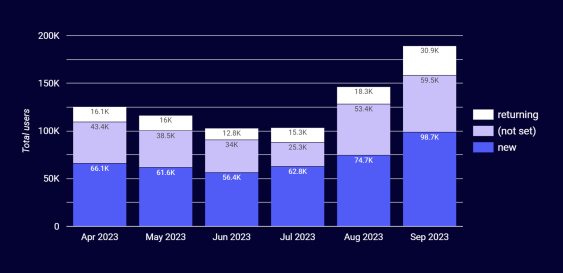
Figure 11: An example Looker Studio Visualisation of GA4 data
Looker Studio not only allows you to take your data infographics to the next level, but also provides a “drag and drop” interface, allowing you to play around with your data at will and uncover more trends and correlations.
There are numerous chart types available within the platform allowing you to create bespoke reports on topics such as website attribution, engagement, and business objective performance. These analytics reports can then be presented and shared in the form of a professional document.
5. The Final Analysis - What We've Learned About Google Analytics 4
We have discussed a lot of important topics in this article; from collecting data in a well-configured GA4 property to analysing data in depth and sharing your findings through the medium of impactful visualisations.
I hope you have learnt something of use whilst reading this, or if not, have enjoyed our guide regardless. GA4 continues to receive ongoing feedback and associated product updates, so watch this space for more news on all things Google Analytics 4 and data intelligence!
7DOTS are not only experienced, but enthusiastic when it comes to data science and data analytics. If there is anything we can do to support you in your Google Analytics 4 journey, do get in touch!
To leave you with one final thought, as Uncle Ben once said, “with great power comes great responsibility”. GA4 collects a lot of personal data, which is why it’s critical that we only collect data from users who have consented for us to do so.
Check out this tool to ensure your site is data compliant: https://www.7dots.com/cookie-compliance-test/
Thank you for reading the ramblings of this mathematician, until next time, happy analysing!
References:
- “Market share of leading web analytics technologies worldwide in 2022”
https://www.statista.com/statistics/1258557/web-analytics-market-share-technology-worldwide/ - “How Many Websites use Google Analytics 2023: Google Analytics Usage Statistics”
https://www.businessdit.com/google-analytics-statistics/ - “How Google Analytics works”
https://support.google.com/analytics/answer/12159447?hl=en - “Introducing the new Google Analytics”
https://blog.google/products/marketingplatform/analytics/new_google_analytics/ - “Prepare for the future with Google Analytics 4”
https://blog.google/products/marketingplatform/analytics/prepare-for-future-with-google-analytics-4/ - “10 things we hate about Google Analytics 4”
https://searchengineland.com/google-analytics-4-we-hate-428942 - “SEOs: What are your thoughts about Google Analytics 4 (GA4)”
https://twitter.com/rustybrick/status/1689253606405398528 - “How Do I Trigger A Scheduled Query When The GA4 Daily Export Happens?”
https://www.teamsimmer.com/2022/12/07/how-do-i-trigger-a-scheduled-query-when-the-ga4-daily-export-happens/